Tom Verducci delivers a mix of expert commentary, inside angles and thoughtful perspectives on baseball’s biggest storylines every week.
Want to ask Tom a question? Visit the Verducci’s View section of SI Forums.
|
|
|
Nick Cammett/Getty Images
|
Four Big-Picture Lessons From the MLB Playoffs So Far |
Welcome back, analog baseball!
This postseason is unraveling some of the tenets that analytic baseball overemphasized. It is bringing back analog baseball, more reminiscent of the 1980s, the most stylized version of the game ever played.
Building on the run of the contact-heavy Blue Jays last year, and a bit of the Diamondbacks’ run in 2023, this World Series proves the old way is the new way. Speed. Athleticism. Moving runners. Here are some truths about this World Series and postseason:
1. The home run is no longer the only coin of the realm.
The past six World Series champions ranked in the top four in homers. That run is over. The Brewers and Guardians/Rays are bottom-nine teams in home runs.
And it’s not just this year. After zero of the 12 pennant winners from 2017–22 hit fewer than 200 home runs, four of eight have done so in the last four seasons.
2. Baserunning matters.
Remember when analytics didn’t like the idea of risking outs on the bases?
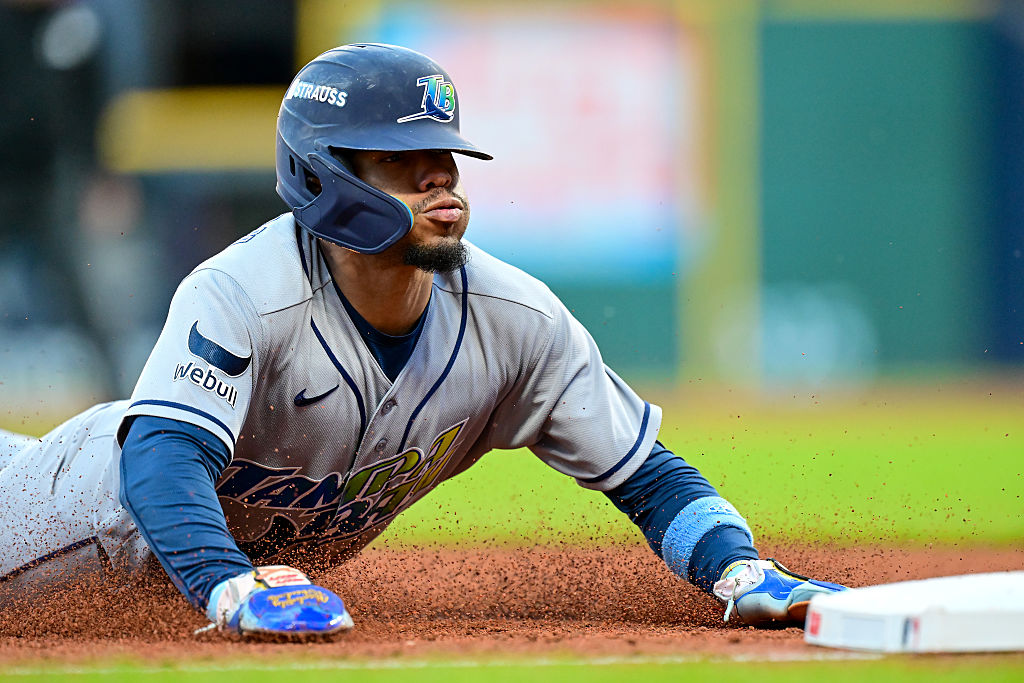
This will be the first World Series in 50 years in which both teams stole at least 146 bases, dating to the 1976 matchup between the Reds and Yankees. (Yes, the new rules have encouraged more chances.)
If the Rays are in, it will be only the second World Series since 1918 in which both teams had at least 162 steals, joining ’76.
The Brewers are the first World Series team in 12 years (2014 Royals) to have more stolen bases than home runs, a common occurrence in the 1980s:
|
| Decade |
Pennant Winners With More SB Than HR |
| 1980s |
8 |
| 1990s |
3 |
| 2000s |
0 |
| 2010s |
2 |
| 2020s |
1 |
|
3. Ground balls are not all evil.
Analytics loves pull-side balls in the air. The top seven teams at that approach are home. The Brewers are last in pull air percentage. They won a pennant with a boatload of grounders, especially to the opposite field.
2026 MLB Ranks, LCS Teams
|
| Team |
Pull Air% |
Ground Ball% |
Opposite Field% |
| Brewers |
30th |
1st |
1st |
| Rays |
27th |
3rd |
2nd |
| Dodgers |
16th |
29th |
10th |
| Guardians |
7th |
22nd |
28th |
|
When I asked Dodgers manager Dave Roberts why his team struggled so much with runners in scoring position (.116 in the postseason) and the Brewers did not (.284), Roberts said, “The angle of their bats.”
When you try for pull-side slug, you are vulnerable to any pitch that moves away or is off-speed. When you hit fastballs middle-opposite as a default approach, you can cover everything.
This next stat is amazing. It defines how Milwaukee, by hitting fastballs deep, creates bat angles more suited to covering a variety of pitches. Against fastballs, the Brewers hit the fewest pull-side home runs. But they hit more home runs than the Dodgers on fastballs not pulled.
Home Runs Off Fastballs by Direction, 2026
|
| Team |
Pulled |
Middle & Opposite |
| Brewers |
22 (Last) |
46 (2nd) |
| Dodgers |
64 (8th) |
43 (7th) |
|
4. Fastballs are back!
This is the first postseason in eight years in which fastballs (including cutters) account for more than half the pitches, which was standard procedure until analytics and spin-tracking took over in 2015.
2026 Postseason Fastball Usage (Data since 2008)
|
| Fastball Stat |
Including Cutters |
Without Cutters |
| Usage rate |
58.6%, highest since 2018 |
50.9%, highest since 2018 |
| Average velocity |
95.4 mph, highest |
96.1 mph, highest |
| Batting average against |
.228, lowest |
.221, lowest |
| SLG against |
.355, lowest |
.354, lowest |
|
Last postseason the splitter was the breakout pitch. Now what drives pitching is throwing three fastballs (four-seam, sinker, cutter) that move in three directions at unprecedented velocities. No wonder the postseason batting average is .213.
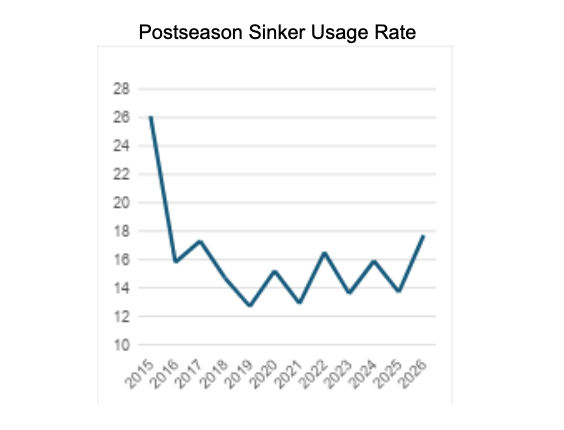
Much of the return to the fastball is because four-seam pitchers are adding the two-seamer. Postseason sinker use has hit an 11-year high:
|
Katelyn Mulcahy/Getty Images
|
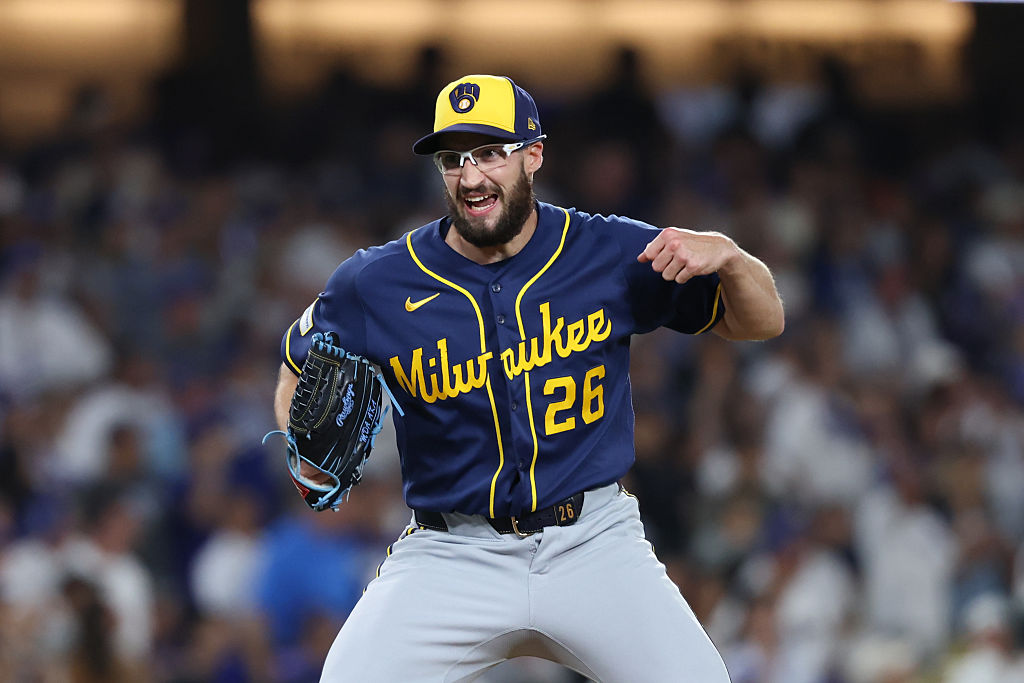
Milwaukee was the best staff in baseball during the season at depressing slug. They throttled the Dodgers in the NLCS with four-seamers in the rotation and sinkers in the bullpen.
The Brewers have thrown 432 consecutive sinkers without allowing a home run (since Sept. 25).
Highest Sinker Use in LCS, 2008-26
|
| Team |
Sinker Use in LCS |
| 1. 2026 Brewers |
33.5% |
| 2. 2015 Mets |
33.0% |
| 3. 2015 Cubs |
32.8% |
| 4. 2015 Royals |
32.1% |
|
The Brewers keep the ball in the park late, squelching quick comebacks. They have allowed no home runs and one run after the sixth inning this postseason by leaning on power sinkers:
Brewers Pitching Innings 7-8-9, Postseason
|
| AB |
Hits |
BA |
HR |
Runs |
Sinker Pct. |
| 77 |
10 |
.130 |
0 |
1 |
44% |
|
Aaron Ashby is a big part of how Milwaukee stifles offense late. Roberts made a mistake in not chasing a two-run deficit in Game 3, though in fairness to him, the Brewers’ bullpen has been so good that chasing a deficit seemed unwise. But by turning the game over to Roki Sasaki and Jason Wrobleski rather than his high-leverage relievers, Roberts missed a chance to force Milwaukee manager Pat Murphy to use Ashby.
The lefthander had been throwing in the Milwaukee bullpen, but when Milwaukee added tack-on runs, he sat down. That enabled Murphy to use a fresh Ashby to close Game 4 by getting nine outs. Ashby joined Lance McCullers (2017) and Vida Blue (1972) as the only pitchers with a three-inning save to clinch the pennant.
The Dodgers went 0-for-7 against his breaking pitches in the NLCS.
“They chased Ashby’s curveball,” Murphy said. “That was key.”
While the Brewers’ sinkers limited late slug, the staff’s breaking pitches flummoxed Los Angeles even more. The Dodgers went 3-for-41 against Milwaukee’s spin, including 0-for-17 against lefthanded relievers Ashby, JoJo Romero and DL Hall.
With elite velocity and spin, the Brewers did a great job of keeping Los Angeles off balance back to front. The Dodgers hit only mid-range velocity pitches.
Brewers Pitching by Velocity, NLCS
|
| Velocity |
Pct. |
BA |
SLG |
| 80–89 |
33% |
.047 |
.047 |
| 90–95 |
27% |
.316 |
.447 |
| 96+ |
40% |
.209 |
.279 |
|
Brewers ace Jacob Misiorowski has not made it through five innings in his two postseason starts. He has done well to limit the Padres to two runs and the Dodgers to one run while those teams taxed him with 50 foul balls combined. His fastball is not the same:
Misiorowski’s Fastball, 2026
|
| Time Period |
Whiff% |
BA |
| Regular Season |
40.2% |
.174 |
| Postseason |
16.1% |
.364 |
|
You might guess it’s a matter of velocity. Misiorowski has thrown 183 innings, an increase of 41 ⅔ innings from last year. But, no, Misiorowski’s heater has a higher average velo this postseason (101.0) than the regular season (100.6). And with his work tapered at the end of the regular season and the bevy of off days in the postseason calendar, Misiorowski will enter World Series Game 1 having thrown only 21 ⅔ innings in the past 45 days. He is well rested.
So, what’s going on? Start with this: hitters are locked in on getting on top of his fastball. They hit .183 in the regular season when Misiorowski landed it in the top third of the strike zone. But in the postseason, when scouting reports deepen and at-bats sharpen, they are hitting .333 on those high heaters.
In addition, Misiorowski has lost a slight bit of his “hop” on fastball. His induced vertical break, a measure of how well a fastball holds its plane, is down by more than an inch. That’s why what used to be swings and misses are turning into foul balls. His fastball also has slightly more arm-side run and slightly less spin. Add it up and you get less life.
Misiorowski’s Fastball
|
| Time Period |
Induced Vertical Break |
Arm-side Tail |
RPM |
| Regular Season |
15.3 |
11.2 |
2,635 |
| Postseason |
14 |
11.7 |
2,559 |
|
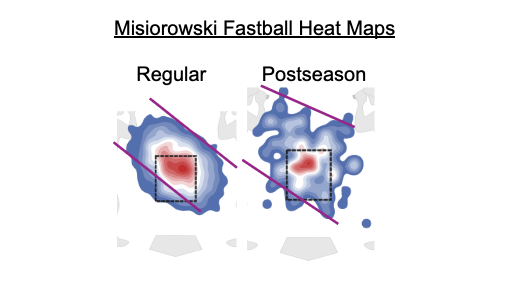
He is still pounding the zone with his fastball (54%, right near his regular season rate of 53%). But his dispersal pattern of his fastball is wider:
Misiorowski Fastball Heat Maps
|
Misiorowski is not getting hit hard. He’s just not getting the usual swing and miss with his fastball and thus has to work harder to put hitters away.
One thing to look for in Game 1: Misirowski’s deceleration. When Misiorowski is right, his hand after releasing the baseball will continue past his body and hit the mid-thigh of his left leg. Against the Dodgers in NLCS Game 1, he often did not have that same looseness and arm speed.
In that game, Misiorowski gave up three hits to right-handed batters on fastballs, tying a career high. In each of them, his hand was stopping in front of his body, shin-high. You can see here a comparison of Misiorowski’s deceleration in NLCS Game 1 and what it looked like at his regular season best.
|
|
|
|
|
Get the print edition of Sports Illustrated delivered to your door.
|
|
|
|
|
|
|
We may receive compensation for some links to products and services included in this email.
Sports Publishing Solutions Inc.
625 Broadway, 10th floor
New York, NY. 10012
You are receiving this email because you are subscribed to the Verducci’s View newsletter.
You can unsubscribe here . Privacy Policy – Terms & Conditions
© 2026 Sports Publishing Solutions Inc. All rights reserved.
SPORTS ILLUSTRATED IS A REGISTERED TRADEMARK OF ABG-SI LLC.
All betting and gambling content included in the Verducci’s View newsletter is intended for individuals 21+ (18+ in DC, KY, NH, RI, and WY). Betting and gambling content, including picks and predictions, are based on individual commentators' opinions and we do not guarantee any success or profits. If you or someone you know has a gambling problem, crisis counseling and referral services can be accessed by calling 1-800-GAMBLER or texting 800GAM.
|
Click this link to view the newsletter in your browser.
|
|
|
|










No comments:
Post a Comment